How to accurately predict range in a Tesla

When I was researching Tesla, I found countless videos and blog posts on how range is impacted by cold, wind, speed, terrain, and various settings on the car itself, which led me to believe that road trips were going to require a lot of planning and energy management. Now that I’ve had the car for a many months and have made multiple long trips, I’ve learned that it’s actually much less complicated thanks to tools that Tesla provides in the car.
UPDATE July 2022: The images below are from my Model X from many firmware versions ago, but the same indicators exist on all of today’s Tesla cars.
The least useful range predictor is the one on the dash
There are various range indicators that the car provides. The one that new Tesla drivers look at the most is actually the least helpful - the total estimated driving distance displayed on the dash:
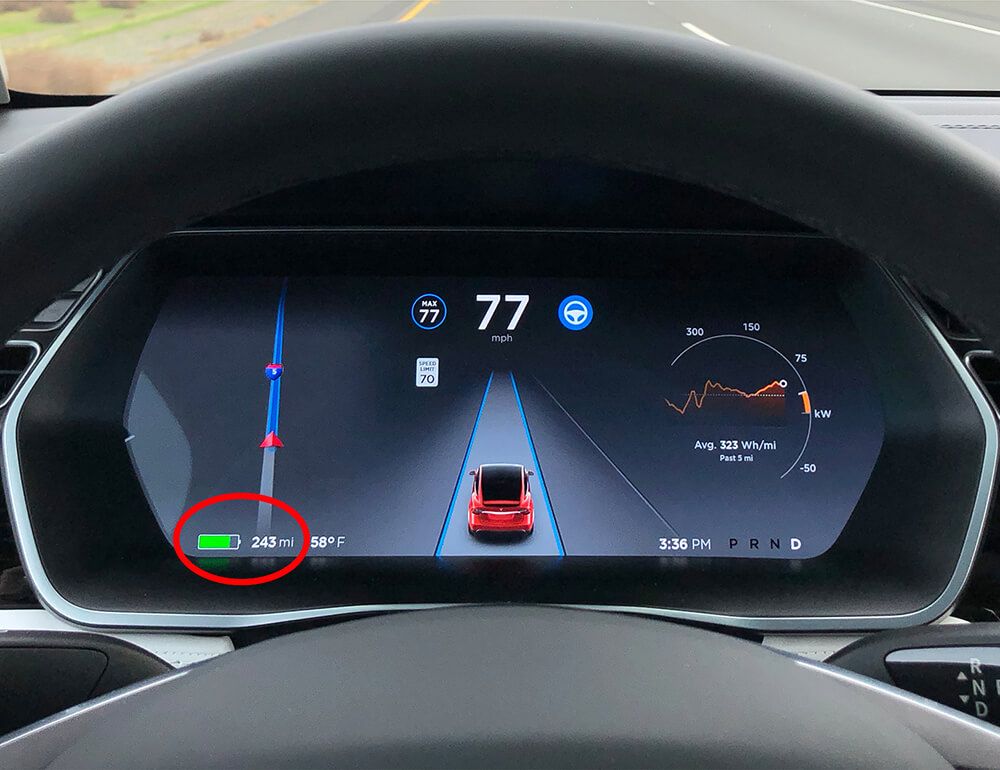
Estimated distance remaining on flat terrain in warm weather and at moderate speeds
In this example, it shows an estimated range of 243 miles. This estimate assumes ideal conditions - flat road, warm temps, no winds, and conservative driving, so unless you’re driving slowly across the salt flats on a 70-degree day, this number is not very helpful.
The slightly better range predictor
There is another range estimate on the consumption screen (displayed on the main screen when you tap the energy button at the top):
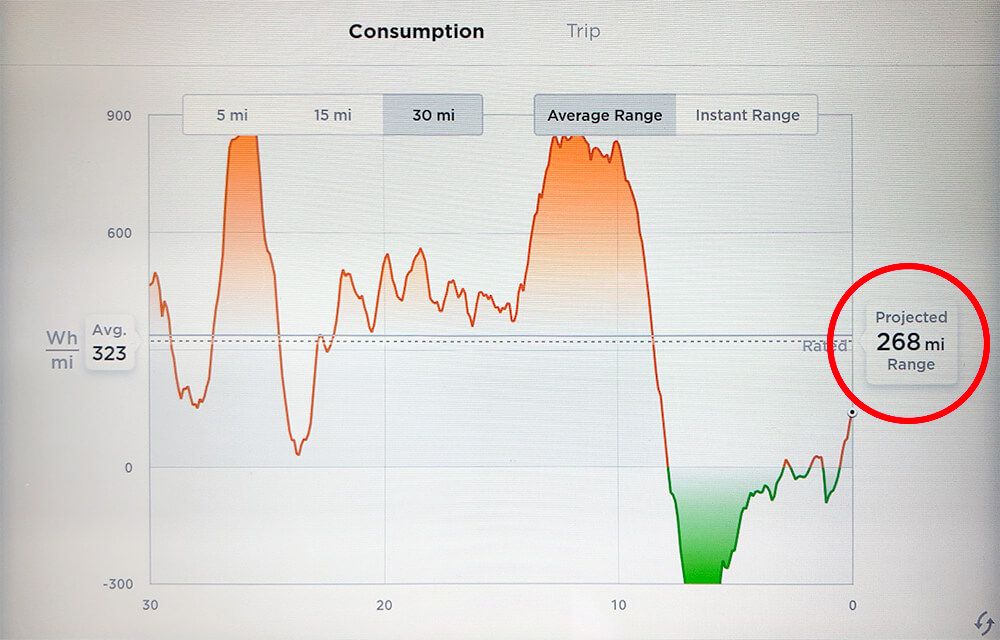
Projected range based on last 5 or 15 or 30 miles of energy consumption
In this example, it shows an estimate of 268 miles based on my last 30 miles of driving. This prediction is slightly better than the prior example because it uses your recent energy consumption to estimate your future consumption, but it’s still not very accurate because the road ahead is not always like the road behind you. In my example above, I went up a steep hill and then down the other side, so you see some extreme usage on the high and low side.
The best range predictor
By far, the most useful estimate is the one provided on the trip prediction screen:
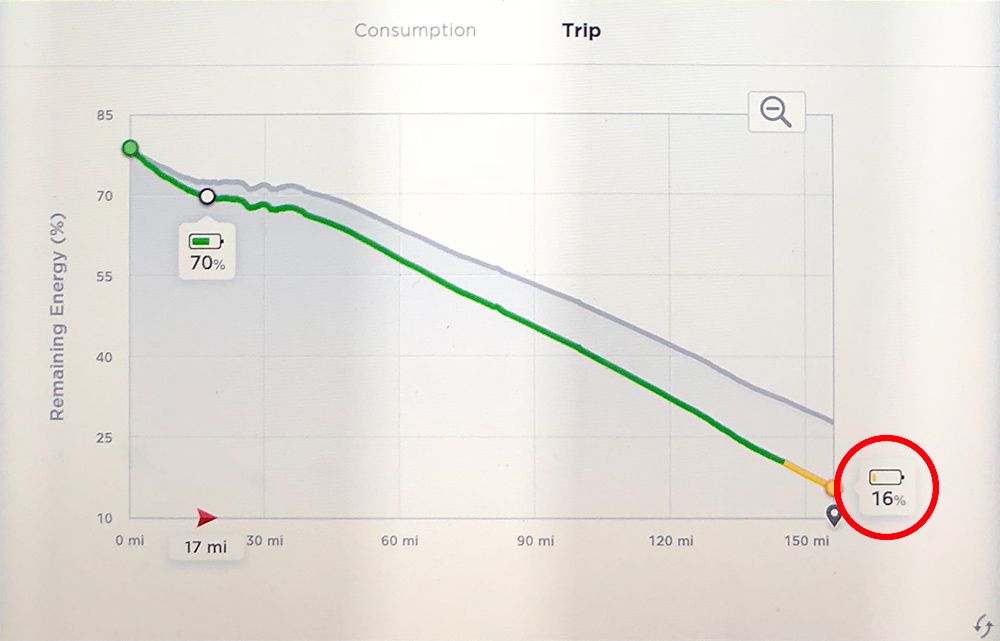
Estimated battery level at destination - accounts for terrain and speed limit!
This screen only works when you have a destination entered in the navigation screen - because to accurately estimate your range, it needs to know where you are going so it can account for hills and speed limits.
Note: To get to this screen, go to the energy screen and click the “Trip” link at the top of it. The Energy screen has two parts – Consumption and Trip. A lot of folks don’t realize that there is this other option!
There are two lines in this graph - a grey line and a colored line. The grey line is the original estimate when the trip starts. The car predicted that I would have around 22% battery left at my next stop. The colored line is the adjusted prediction based on energy usage so far and is updated in real-time as the trip continues. I’ve found that the original estimate is usually very accurate and the two lines often follow nearly the same path, but in this example, the outside temp was about 20F, so there was a significant difference between the original prediction and the adjusted prediction as a result of the cold. At only 17 miles into the trip, it was already telling me that energy was being consumed faster than expected.
Compensating as needed
When you see these lines start to diverge, you need to pay attention and adjust as needed. In my above example, the 16% estimate held so I continued the trip without changing anything. However, on another leg of this trip, the original estimate was 17% and quickly dropped to 5%, so I knew I had to compensate to maintain a decent margin. There are a few obvious things you can do to compensate:
- Find a supercharger that is closer - this is what I did on this particular leg of my trip. I went to the navigation screen, tapped on the map so that the buttons displayed, and then tapped the lightning bolt to show all nearby superchargers. I discovered that there was a supercharger between me and the originally planned supercharger, so I just stopped at the closer one.
- For the remainder of the trip, I also charged a bit beyond what the car recommended since I knew that the next leg would have the same temperature challenges. If the car recommended 30 minutes of charging before continuing the trip, I would stay another 15 minutes to compensate for the energy drain that I knew was coming.
- Slow down - speed impacts range a lot. Dropping below the speed limit can start to have a noticeable positive impact on the predicted range. I experimented a bit on a recent trip going from 70MPH (the speed limit) to 50MPH. The green line started trending above the grey line!
- Lower energy consumption by turning down the heat (note: seat heaters use far less energy than the heater in the car, and you might find you can stay just as comfortable). Things like the radio, interior lights, etc. don’t make enough difference to bother with. Just focus on the big things. In my travels, I have never had to turn off the heat or anything. Slowing down made all the difference I needed. When it’s a choice between heat and slowing down by 5MPH, I’ll slow down.
Wind!
On a recent trip (Las Vegas to San Francisco), I ran into another range factor - wind! I noticed that the lines on the trip screen were diverging, but the temp was around 60F, so at first, I was surprised that the range was dropping.
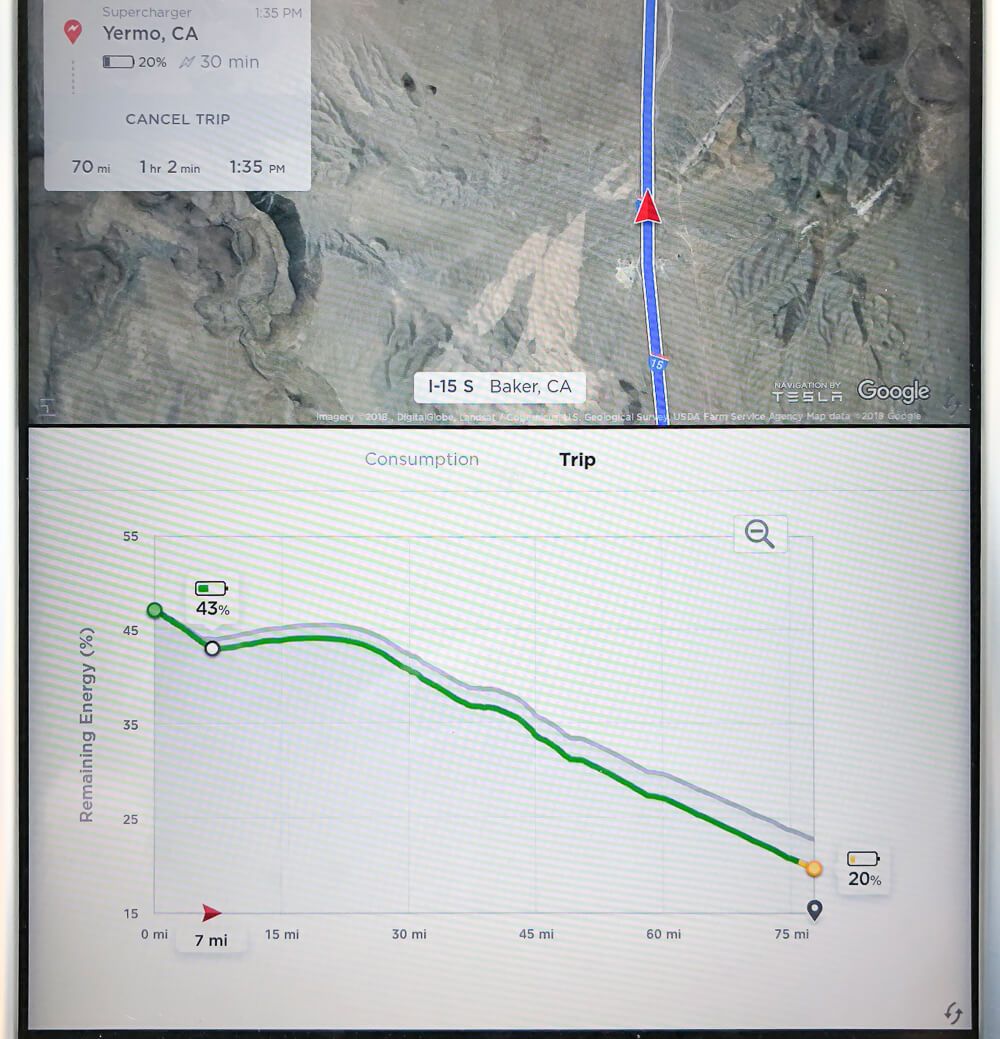
Wind impacts range too!
As I continued the trip, I could tell it was windy because I could feel it rocking the car. Then it hit me - it was likely a headwind impacting my range. I checked the local weather conditions, and as expected, there was a 20-30MPH wind from the west. I had to make a few adjustments to my trips similar to the ones I made on the Colorado trip when the cold was impacting range.
I bet the cars traveling east enjoyed the benefits of a strong tailwind. The colored line likely was above the grey line.
Check out the graph in the image above – notice how the lines go up between 5 miles and 20 miles. Yes, the remaining energy actually increased during this part of the trip! How is this possible?! It’s simple – it was a steep descent during a 15 miles stretch of highway, so the car was generating electricity as it went down the hill. So, this graph also does a good job of showing you when you’ll be going up or down hills.
Summary:
- The trip screen is by far the most accurate tool for predicting range
- The trip screen is the only range tool in the car that factors in hills and speed limit
- Cold temperatures can have a significant impact on range
- Wind can also have a significant impact on range
- Slowing down is the easiest and most effective way to stretch your range
- On most trips, you don’t have to worry about the little things like heat and AC if you just do a bit of planning
I’d love to see Tesla enhance this screen to consider temperature and winds when predicting the range.
The obligatory referral code — http://ts.la/greg4062 🙂